Reporting
Dashboards to drive operational excellence

- More than just a Pivot Table – click any position and check details of an item (eg. a list of invoices).
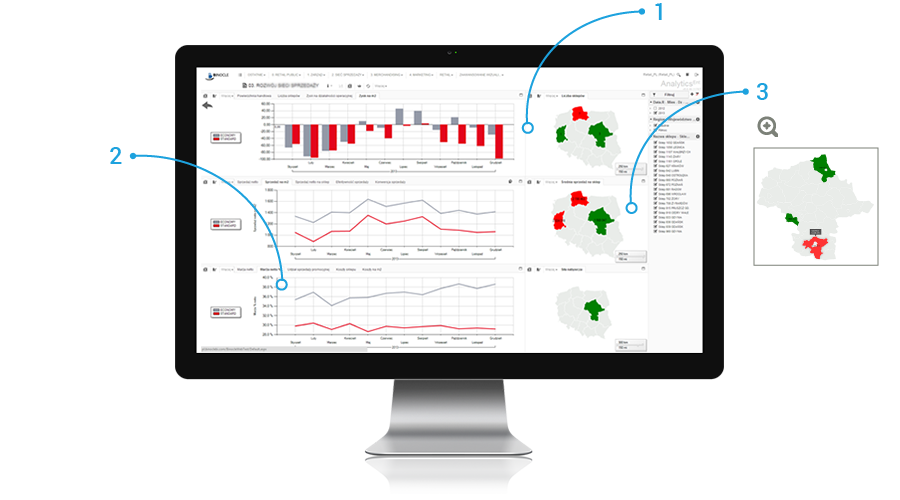
- Dashboard – check data from multiple sources on a single screen.
- Interactive charts with the ability to drill down to detailed data.
- Interactive maps, also with the ability to drill down.
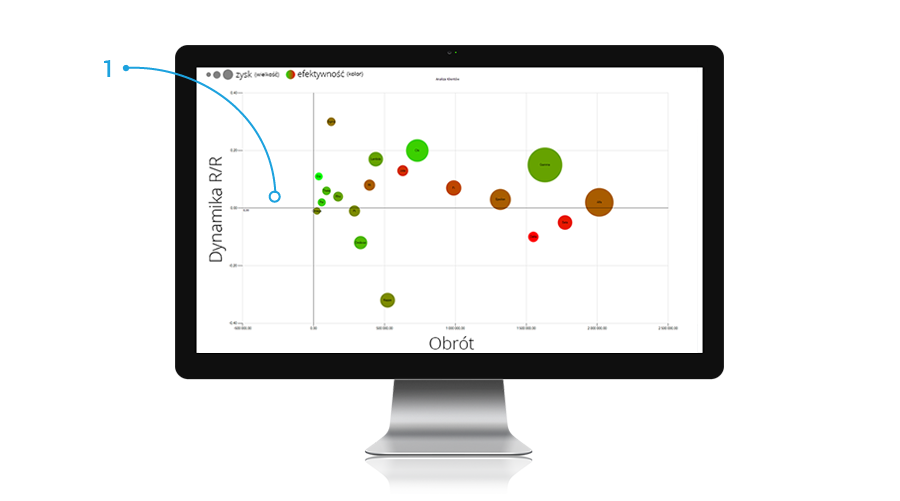
- Analyze four measurements on a single graph (impossible to display in an Excel table). It takes just seconds to spot the most efficient and profitable products.
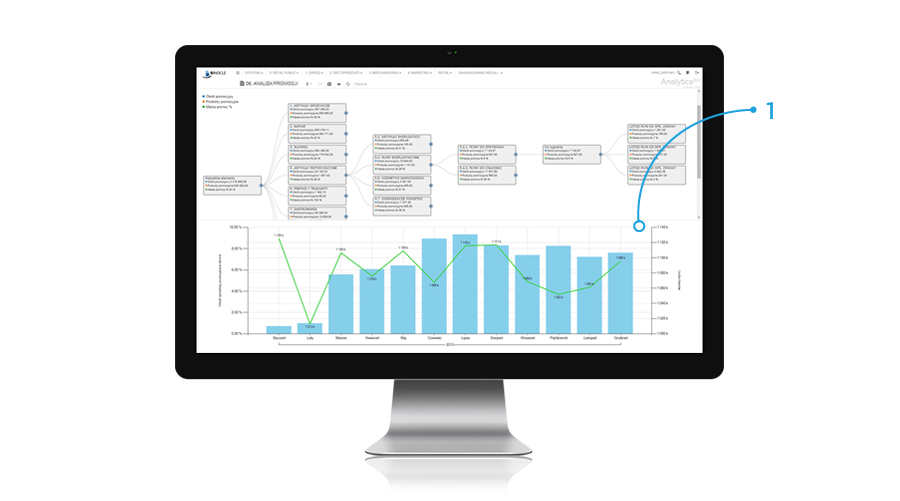
- Marketing campaign analysis – find the relationship between various levels of detail (eg. sales of individual product groups broken down into components).

- Balanced Scorecard – presents key indicators of your organization. Harvard Business Review found the scorecard to be among the 100 most important economic ideas of the twentieth century.
- Chart – a graphic supplement for Scorecards. It enables fast analysis of large amounts of data.